
All articles
hexbins
Hexbin Maps: Aggregating Points into Hexagons
By GeoMaps Team · June 18, 2026 · 2 min read
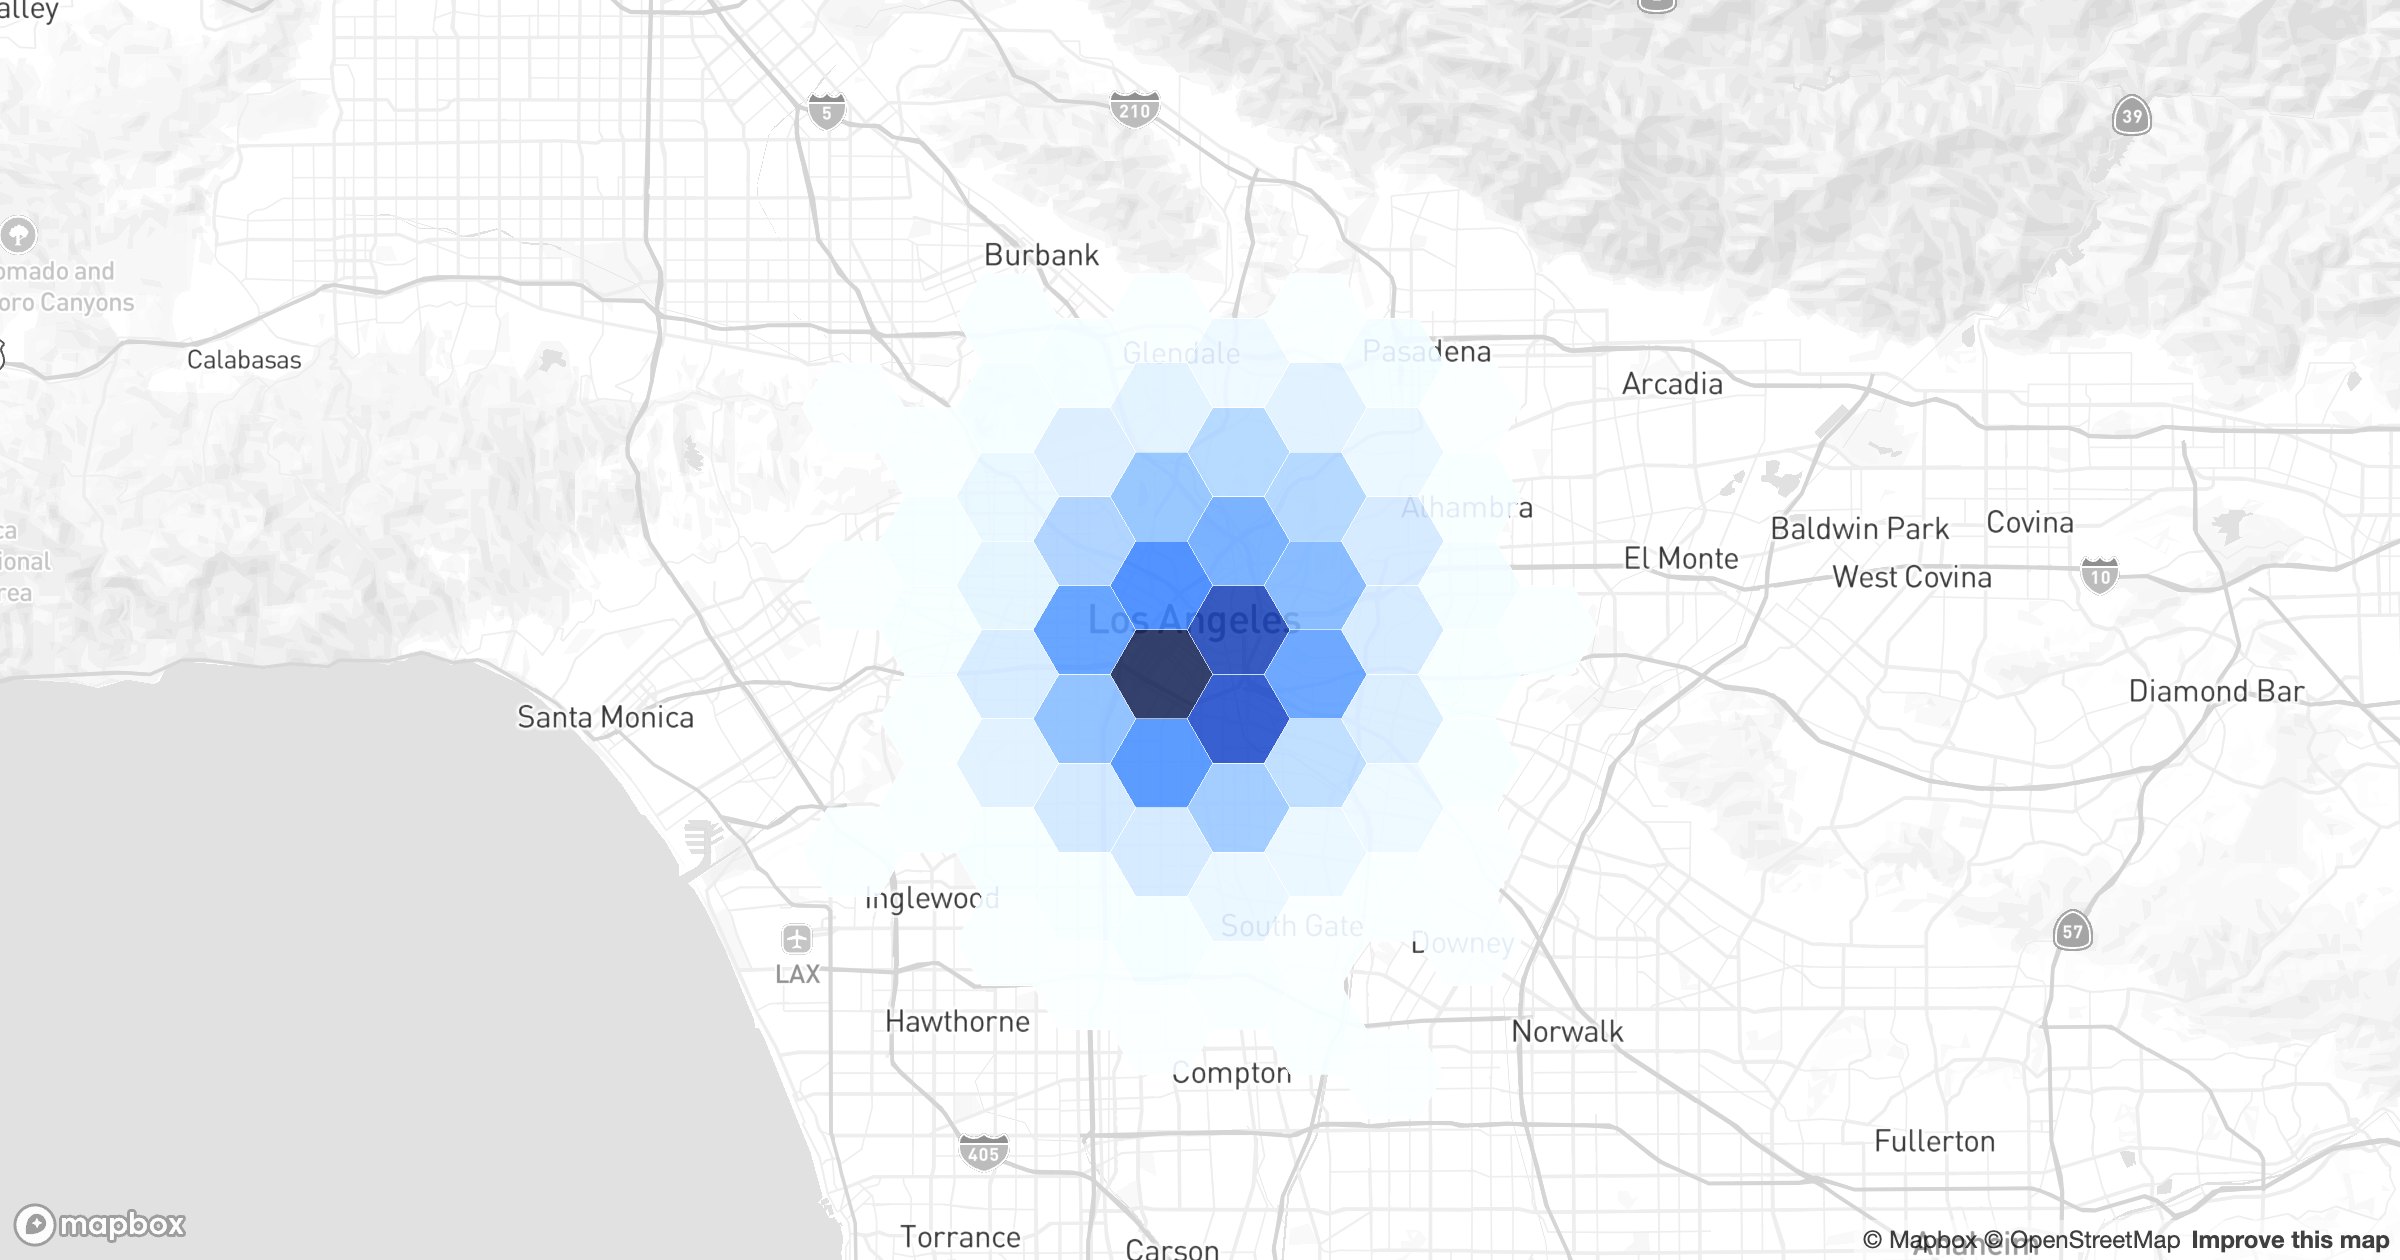
A heatmap is beautiful but vague — you can't read an exact value off a glow. A hexbin map keeps the at-a-glance density while giving every area a crisp, countable cell. And because hexagons tile evenly, no bin is unfairly bigger than its neighbors.
Even cells, honest comparison
GeoMaps drops a hexagon grid over your points and shades each hex by how many fall inside. The result is the same density story as a heatmap, but in discrete steps you can actually compare — darker hex, more records.
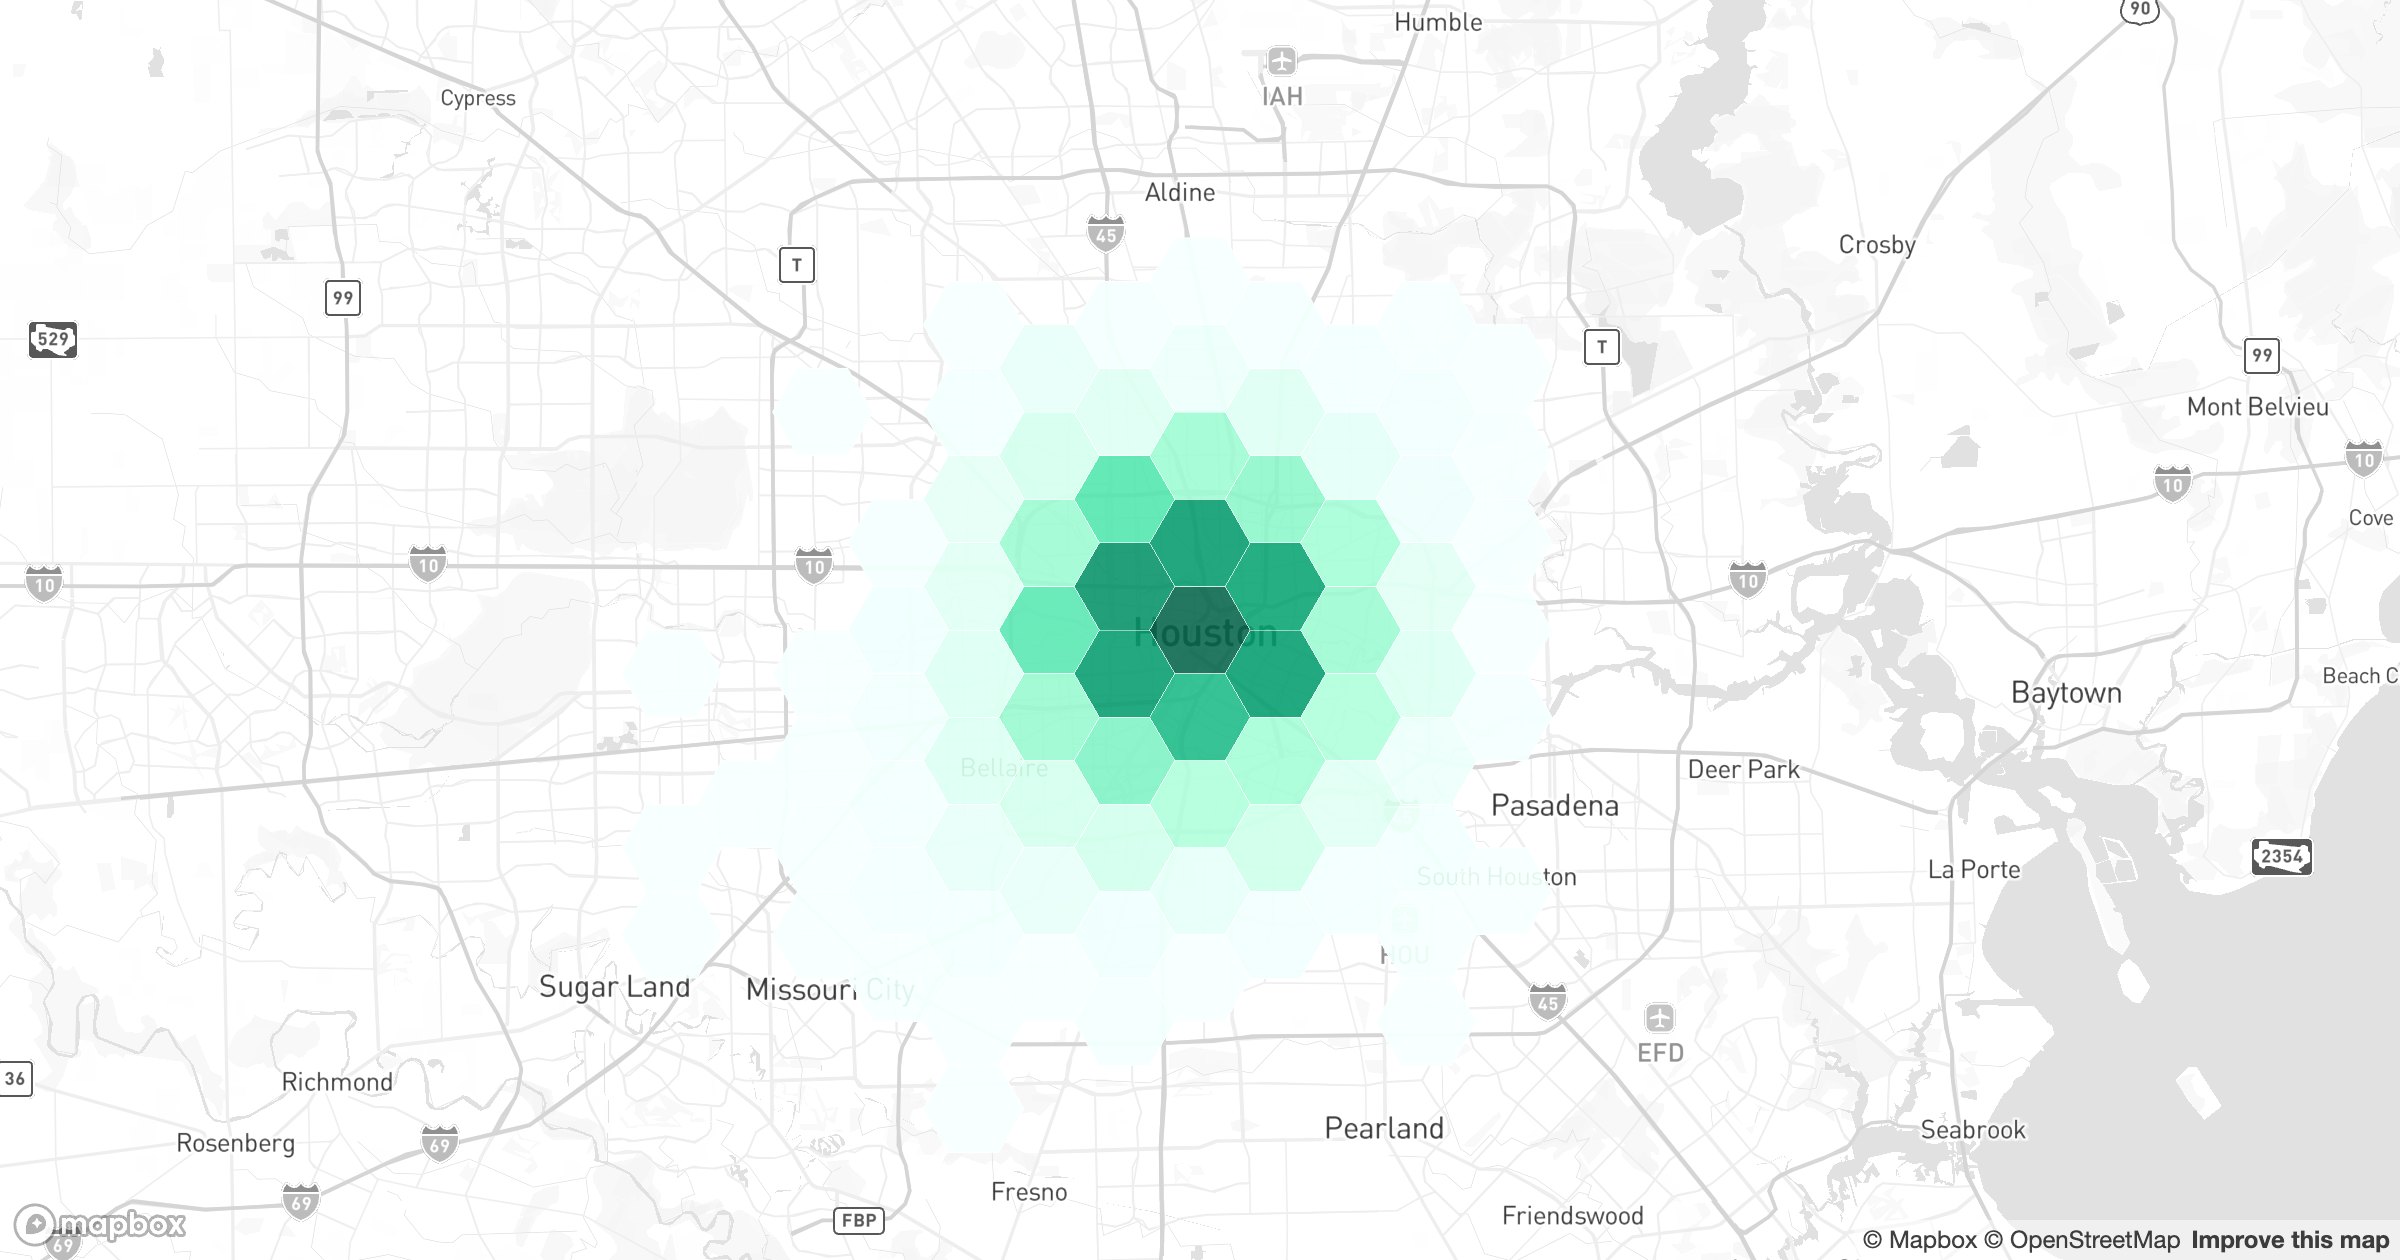
Tighten or loosen the hex size to move from a metro overview down to a few blocks, and the bins re-tally to match. It's the analyst's heatmap: pretty and precise at once.
Learn more
Explore Hexagons visualization