
All articles
grids
Grid Maps: Aggregating Data into Equal Cells
By GeoMaps Team · July 2, 2026 · 2 min read
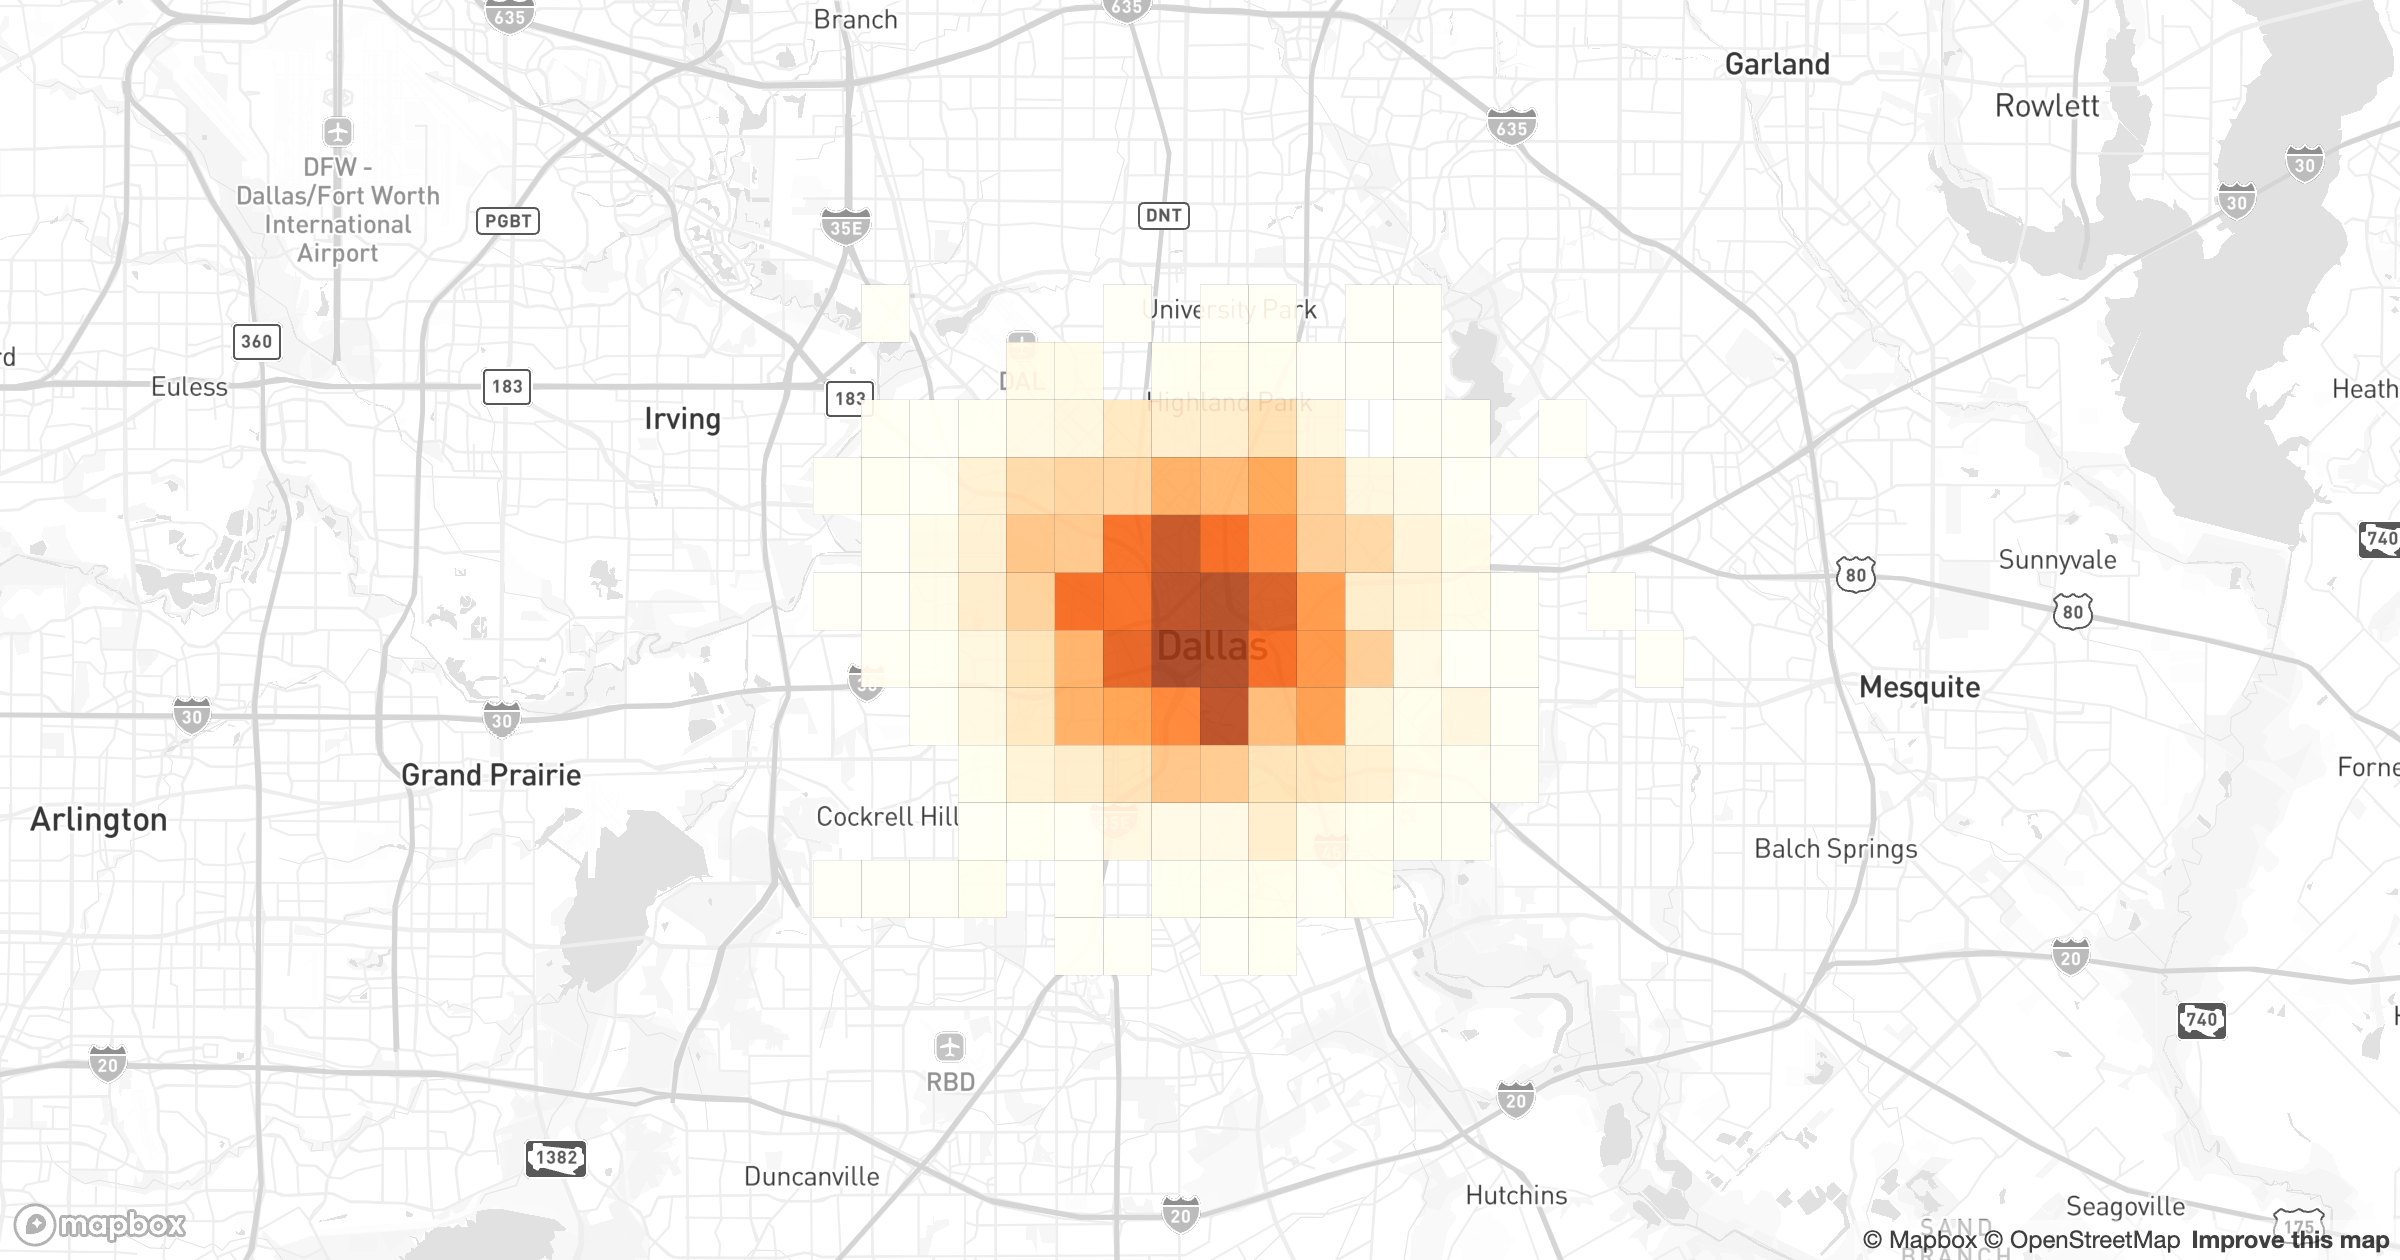
Points cluster unevenly and neighborhoods come in odd shapes, which makes "which area is busiest?" surprisingly hard to answer fairly. A grid fixes that by imposing equal squares and counting what lands in each.
Same-size cells, fair counts
GeoMaps lays a uniform grid over your data and shades every cell by its count. Because each square covers the same ground, you can compare them directly — no big district looking busy just because it's big.
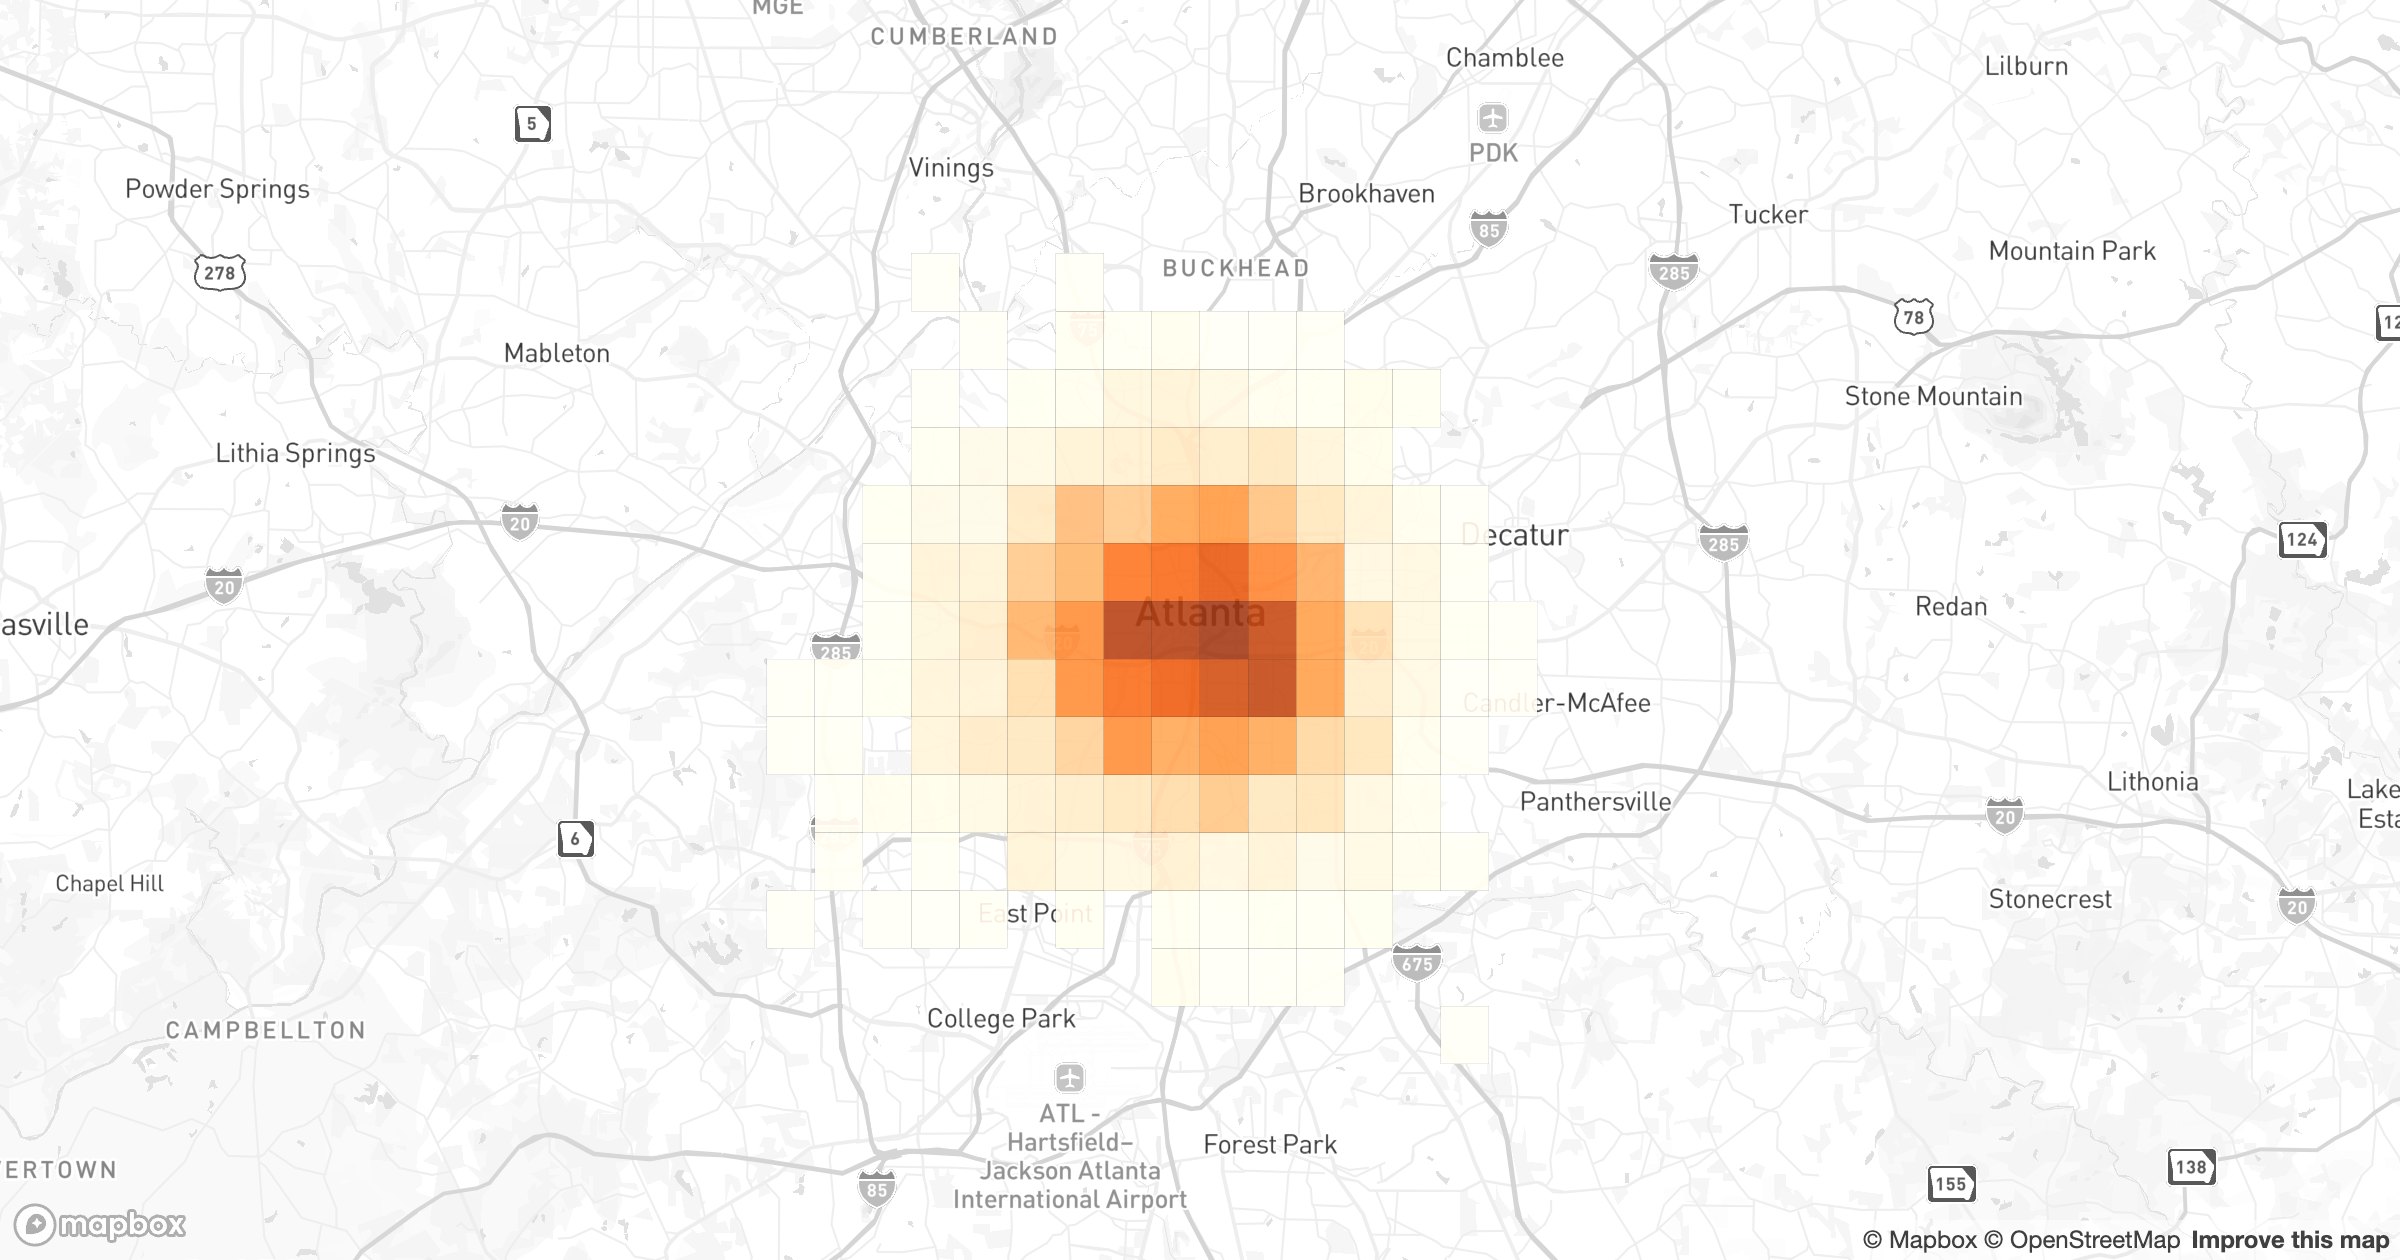
Resize the cells to move between a coarse overview and a fine-grained read, and the counts re-tally instantly. Where the hexbin is the analyst's heatmap, the grid is the spreadsheet's — clean rows and columns, drawn on the map.
Learn more
Explore Grid visualization