
Choropleth Maps: Shade Regions by Your Data
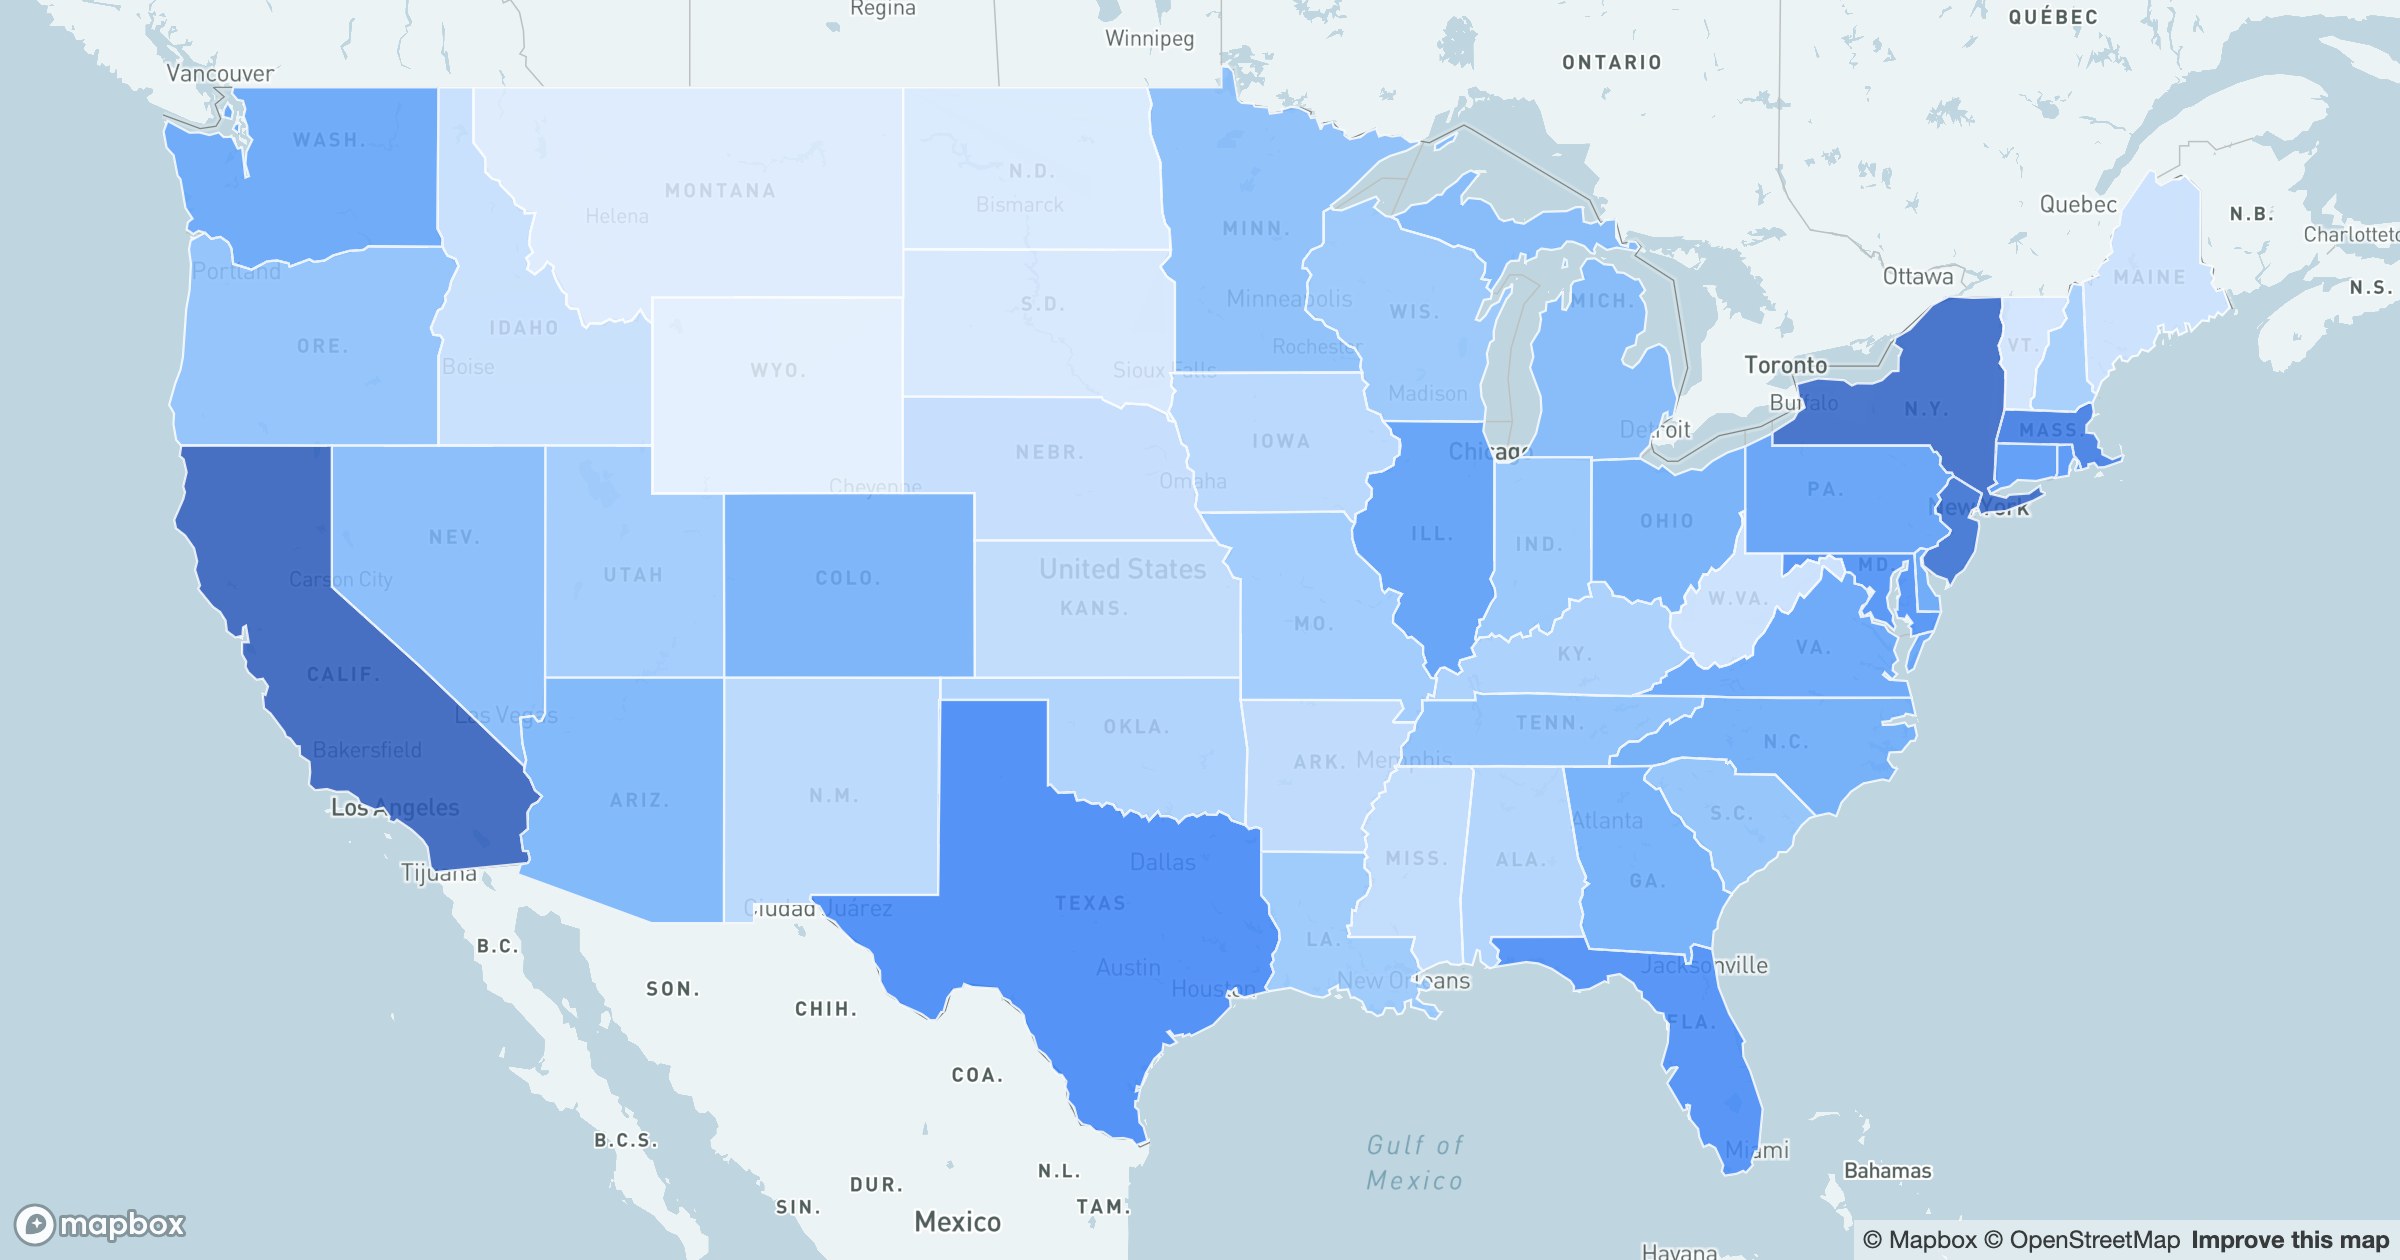
Some questions aren't about individual points at all — they're about places. How does a metric vary state by state, or country by country? A choropleth answers it by filling each region with a color drawn from a single value, turning a column of numbers into a picture you can read instantly.
One ramp, many stories
GeoMaps maps each value onto a sequential ramp: pale where the number is low, deepening as it climbs. The boundaries stay crisp, so neighboring regions are easy to compare and outliers practically announce themselves — the one dark county in a pale state, the bright cluster along a coast.
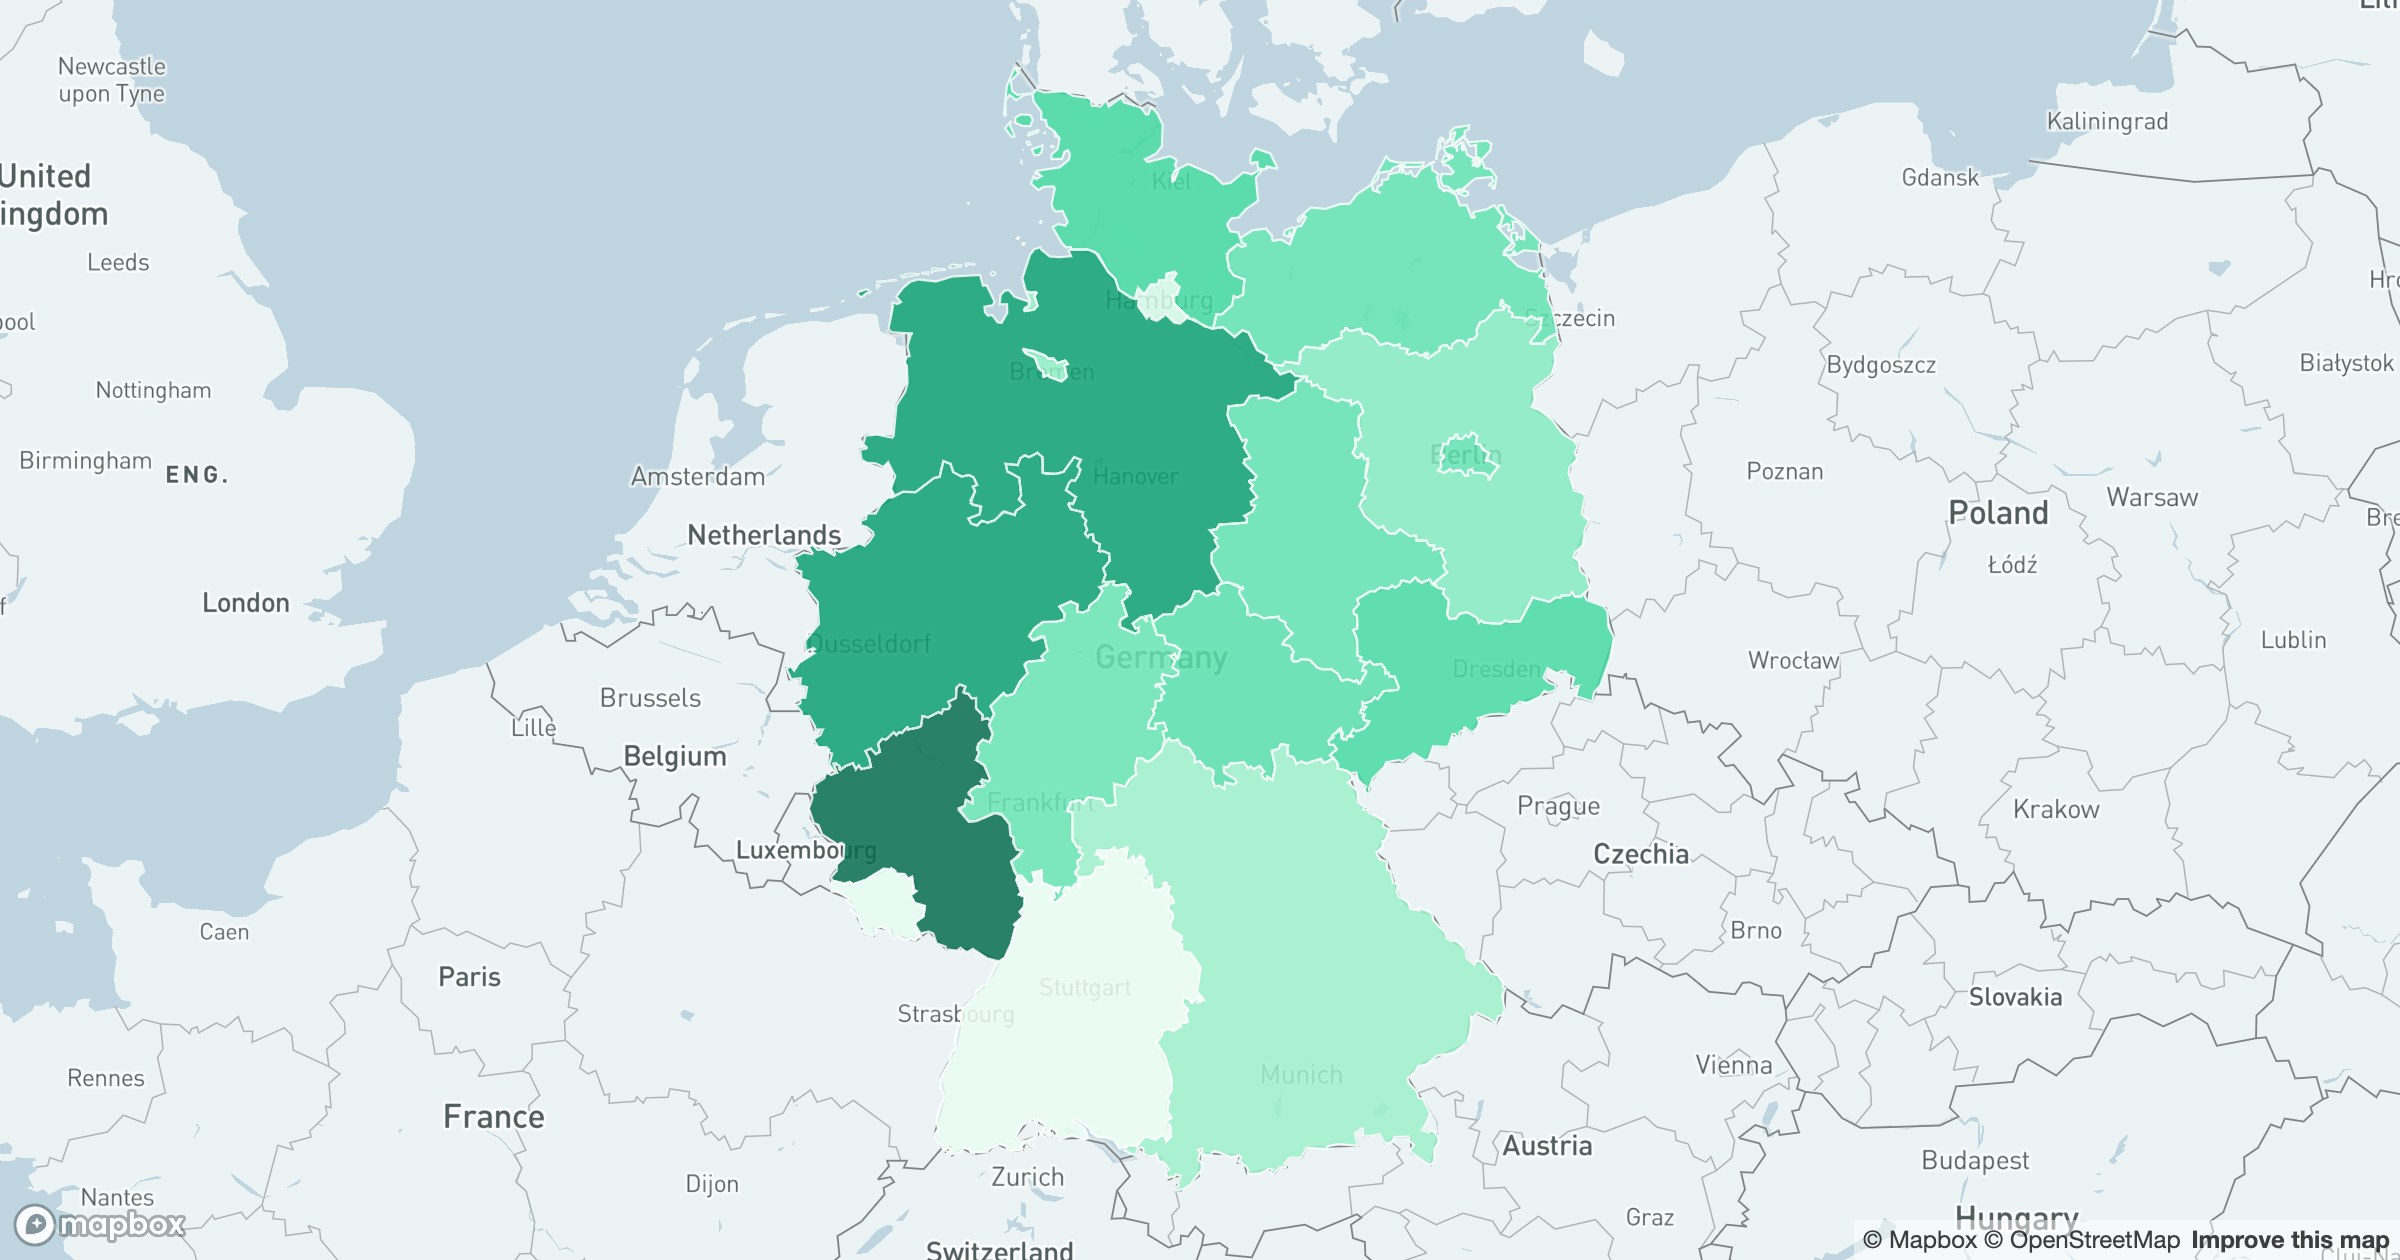
Because it's driven by administrative boundaries rather than raw points, the same approach works at any level and in any country — US states, German Länder, counties, or ZIP codes — and it scales down smoothly when you need a finer grain.
Sales by territory, customers by state, coverage by region, adoption by market — anything you can total per area becomes a map a stakeholder can absorb in seconds, without a legend lecture.